Key Takeaways
- Kusama looks like it’s approaching a local top after surging over 13% in the last 12 hours.
- Polkadot rose by only 4.4% in the same period but has yet to slice through critical resistance.
- While KSM looks poised to retrace, DOT may gain further bullish momentum.
The canary network for the Polkadot blockchain, Kusama, has recently enjoyed a rally in the market. Now, the technicals point to a brief correction that may allow DOT to take the lead.
Kusama Posts Rally
Kusama has outperformed Polkadot in the latest market bounce, but the near-term outlook for both assets differs.
Kusama has surged by nearly 13% over the last 12 hours as the cryptocurrency market enjoys new tailwinds. The Polkadot canary network jumped from a low of $61 to local high of $69. Despite the upward price action, KSM now looks bound for a spike in profit-taking.
The Tom DeMark (TD) Sequential indicator has presented a sell signal on Kusama’s daily chart. The bearish formation developed after KSM met the 32% upside target that a descending triangle had forecasted. An increase in selling pressure could help validate the pessimistic outlook, leading to a correction to $61 or even $57.
Kusama would likely need to print a daily candlestick above $68 to have a chance at invalidating the bearish thesis. If it succeeds, the critical areas of resistance to watch are $73, $76, and $81.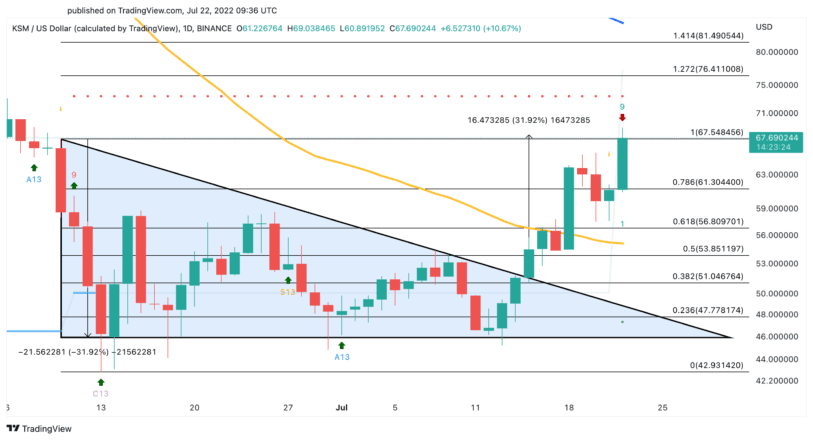
While Kusama looks like it’s nearing a local top, Polkadot appears to have more room to ascent. DOT has risen 4.4% in the past 12 hours, which helped it move above the 50-day moving average at $7.60 on the daily chart. A decisive close above this crucial resistance area could signal the continuation of the uptrend.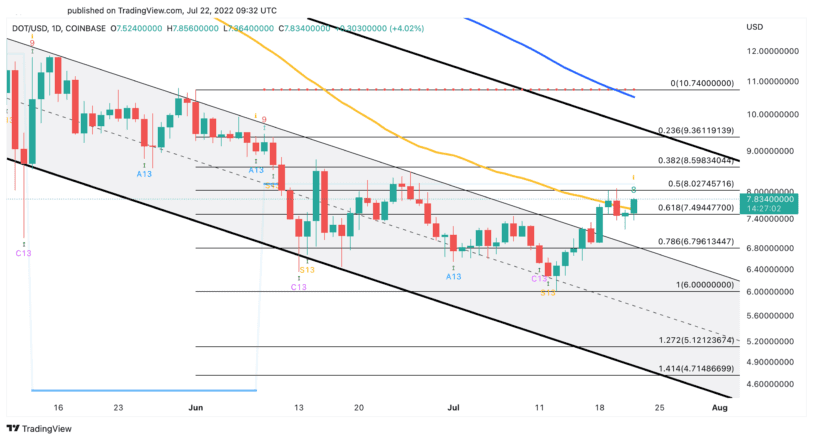
Given that Polkadot broke out of a descending parallel channel on July 18, it had a good chance of posting a 20% upswing toward $9.40. However, DOT needs to breach the 50-day moving average and overcome the $8 resistance level to get there. If it fails to do so, it could suffer a steep correction to $6.80.
Disclosure: At the time of writing, the author of this piece owned BTC and ETH.